

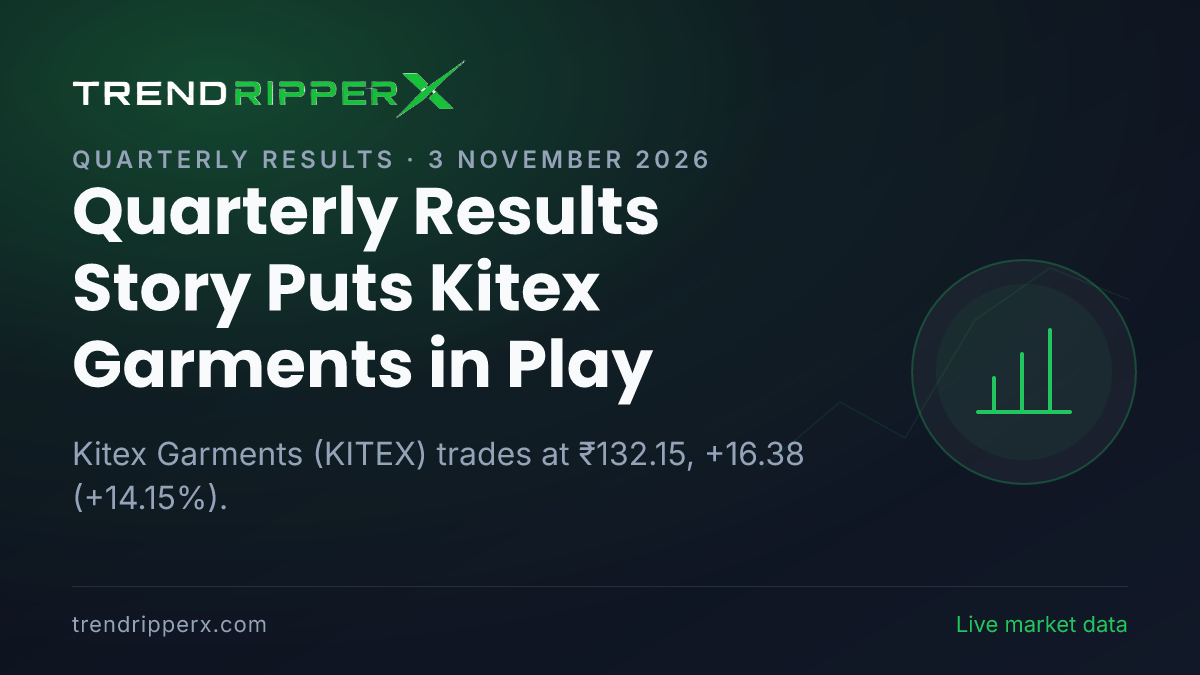
NSE: KITEX
KITEX GARMENTS LTD
Price history
-10.48% over 3M
Performance
52-week range
Position in day range
KITEX stock DNA
Signals computed live from NSE price history — trend, momentum, volatility and participation in one view.
Trend
Sideways
50-DMA ₹120.32
RSI (14)
68
Neutral momentum
Volatility (ATR)
4.48%
High
Close streak
1d up
Volume vs 20d avg
25.25x
Unusual activity
From 52W high
-42.75%
Up from 52W low
+20.18%
Green days (20)
8/20
Monthly seasonality
Average monthly move for KITEX across the available price history.
Key statistics
Open
126
Day high
138.91
Day low
125
Prev close
115.77
Volume
1.97 Cr
Avg vol (20d)
7.78 L
52W high
230.9
52W low
110
KITEX quarterly results
All KITEX results →Next results date
Awaiting intimation
Last results date
2 Nov 2026
Reports published
1 quarter covered
Revenue
₹203 cr
+66.3% YoY
Net profit
₹13.71 cr
+984.4% YoY
Operating profit
₹26.46 cr
+210.5% YoY
EPS
₹0.84
+1150.0% YoY
Swipe sideways to see all columns →
| Quarter | Revenue | Operating profit | Net profit | OPM | Net margin | EPS | Profit YoY | Profit QoQ |
|---|---|---|---|---|---|---|---|---|
| Q2 FY272026-09-30 | ₹203 cr | ₹26.46 cr | ₹13.71 cr | 13.0% | 6.8% | ₹0.84 | +984.4% | +171.7% |
| Q1 FY272026-06-30 | ₹158 cr | -₹7.39 cr | -₹19.11 cr | -4.7% | -12.1% | ₹-0.45 | -192.1% | -388.4% |
| Q4 FY262026-03-31 | ₹166 cr | -₹18.57 cr | -₹3.91 cr | -11.2% | -2.4% | ₹-0.20 | — | +58.3% |
| Q3 FY262025-12-31 | ₹182 cr | -₹4.7 cr | -₹9.39 cr | -2.6% | -5.2% | ₹-0.47 | — | -505.8% |
| Q2 FY262025-09-30 | ₹122 cr | -₹23.94 cr | -₹1.55 cr | -19.6% | -1.3% | ₹-0.08 | — | -107.5% |
| Q1 FY262025-06-30 | ₹197 cr | ₹31.01 cr | ₹20.76 cr | 15.8% | 10.6% | ₹1.04 | — | — |
| TTM (last 4 quarters) | ₹710 cr | -₹4.2 cr | -₹18.71 cr | -0.6% | -2.6% | ₹-0.28 | — | — |
Consolidated figures as reported to the exchanges, shown in ₹ crore. OPM = operating profit margin. Updated automatically whenever a new quarter is filed.
Latest coverage
Latest market news
State Bank Of India Q2 FY27 Results: Net Profit ₹23,038 cr
State Bank Of India Q2 FY27 standalone results: revenue from operations of ₹1,32,019 cr and net profit of ₹23,038 cr.

Why Quarterly Results Is the Most-Covered Market Story This Closing — 3 November 2026
The most-covered market themes in the closing session on 3 November 2026 — quarterly results, gold, industry and sectors — with our live numbers for each and links to the publishers running the story.

Stocks in News Today (3 November 2026): BRITANNIA INDUSTRIES LTD +4.98%, Gap Ups, Gap Downs and Volatile Counters
Stocks to watch on 3 November 2026: the biggest large-cap gainers and losers, gap-up and gap-down openings, and the most volatile counters of the session with live prices.

Why Quarterly Results Is the Most-Covered Market Story This Midday — 3 November 2026
The most-covered market themes in the midday session on 3 November 2026 — quarterly results, industry and sectors, gold — with our live numbers for each and links to the publishers running the story.
Maharashtra Seamless Edges Up to ₹541.00 After Order Win Update — Levels, Volumes and the Follow-Up to Track
Maharashtra Seamless (MAHSEAMLES) trades at ₹541.00, +3.60 (+0.67%) as the order-win story plays out. Live board, day range, twelve-month context and the follow-up that decides the next session.
Quarterly Results Story Puts Bajaj Finserv in Play: Share Price Edges Up to ₹1,708.20, and Here Is the Arithmetic
Bajaj Finserv (BAJAJFINSV) trades at ₹1,708.20, +16.70 (+0.99%). The quarterly-results trigger, the levels the tape is defending, and what the numbers mean for traders and long-term holders.
Price and history data from NSE via Upstox. For information only, not investment advice.