

Altrix Scan Flags 168 NSE Stocks Positive as Hourly Uptrends Reach 57%
Quick answer
At 11:29 am IST on 20 September 2026, the Altrix scan evaluated 2,356 NSE stocks, flagging 168 positive and 306 negative setups across the cash market.

Quick summary
Stocks scanned
2,356
Altrix Positive
168
Altrix Negative
306
Stocks in uptrend
1336 (57%)
BODY:
Active capital allocators monitoring cash-market liquidity received a clear diagnostic of broad underlying health on 20 September 2026, as algorithmic sweep tools registered sustained participation across secondary market equities. When market participants balance immediate tactical opportunities against broader risk exposure, single-stock momentum can easily obscure underlying market structure. The Altrix scan provides an objective look at structural price action across the National Stock Exchange (NSE) cash universe, eliminating subjective bias by evaluating high-frequency price updates on a unified baseline.
At 11:29 am IST, our quantitative tracking system processed price action, candle structure, and trend momentum across 2,356 individual cash-market listings on the 1-hour timeframe. The resulting readout offers institutional desks and retail market participants a granular snapshot of market breadth, sectoral dominance, and underlying momentum distribution.
What the Altrix scan is showing on 20 September 2026
Altrix ran across 2,356 NSE cash-market stocks on the 1-hour timeframe at 11:29 am IST. Of those, 168 currently read Altrix Positive, 306 read Altrix Negative, 245 are Strengthening, 306 are Improving and 481 are Weakening. Market-wide, 1336 stocks (57% of the scanned list) are in an uptrend — that single number is the fastest read on whether the tape is rewarding buyers or sellers right now.
Understanding this overall distribution requires breaking down how dynamic breadth influences underlying risk distribution. When 1336 individual securities out of a universe of 2,356 maintain an intact uptrend, the underlying broad market baseline demonstrates structural resilience. A broad uptrend proportion of 57% demonstrates that buyers retain control across more than half of the traded universe, providing a constructive backdrop for trend-following strategies.
However, market structure is rarely uniform. While 1336 counters showcase positive trend orientation, the distribution of short-term structural flags highlights localized institutional activity. Specifically, the scan registered 168 stocks displaying active Altrix Positive signals, contrasted against 306 counters generating Altrix Negative flags. Furthermore, transitional states illustrate an active shift beneath the surface: 245 names are classified as Strengthening, 306 are categorized as Improving, while 481 exhibit Weakening price behavior. This variance confirms that even within a broadly stable equity tape, selective rotational flows are dictating individual ticker performance.
How to read these numbers and structural indicators
Navigating technical scan data requires a clear understanding of what quantitative breadth signals represent on short-term chart structures. The 1-hour timeframe serves as an intermediate bridge between noisy intraday scalp cycles and slower daily swing charts. When an engine evaluates price action on an hourly resolution, it filters out micro-bid-ask noise while capturing real-time shifts in institutional accumulation or distribution.
To interpret the outputs effectively, market participants must distinguish between general trend classification and specific algorithmic flags:
- Overall Trend State: The baseline assessment (1336 stocks in an uptrend, representing 57% of the 2,356 evaluated listings) determines whether macro supply or demand is dominant. An uptrend classification indicates that the sequence of higher highs and higher lows remains unbroken on the 1-hour chart.
- Altrix Positive vs. Altrix Negative Flags: These are immediate quantitative flags that fire when specific price, volume, and momentum criteria align. A total of 168 listings currently meet the strict criteria for Altrix Positive, whereas 306 counters triggered Altrix Negative signals.
- Transitional Classifications: Categories like Strengthening (245 stocks), Improving (306 stocks), and Weakening (481 stocks) track relative momentum changes before a full trend shift occurs. A weakening stock is experiencing momentum decay, whereas an improving stock is emerging from a consolidation phase.
By evaluating these dimensions simultaneously, traders can determine whether a price movement is backed by broad-based buying or represents an isolated counter-trend spike.
Stocks reading Altrix Positive
| Stock | Price (₹) | Change | Trend | Reading | Strength |
|---|---|---|---|---|---|
| JAYKAY | 167.18 | +6.44% | Uptrend | Altrix Positive | Very High |
| ZENITHEXPO | 203.95 | +3.55% | Uptrend | Altrix Positive | High |
| ABBOTINDIA | 27,270.00 | +5.25% | Uptrend | Altrix Positive | High |
| SVPGLOB | 3.49 | +4.18% | Uptrend | Altrix Positive | High |
| BHARTIHEXA | 1,540.10 | +4.77% | Uptrend | Altrix Positive | High |
| CAPILLARY | 484.05 | +7.82% | Uptrend | Altrix Positive | High |
| DCMSIL | 70.26 | -0.04% | Uptrend | Altrix Positive | High |
| ENIL | 101.90 | +1.04% | Uptrend | Altrix Positive | High |
| PAVNAIND | 15.67 | +4.82% | Uptrend | Altrix Positive | High |
| GANDHAR | 276.20 | +2.56% | Uptrend | Altrix Positive | High |
| MITTAL | 0.77 | +1.32% | Uptrend | Altrix Positive | High |
| SAMPANN | 24.67 | +1.69% | Uptrend | Altrix Positive | High |
These are the strongest readings in the public snapshot. A positive reading is a structural observation on the hourly chart, not a buy call — it tells you the stock is behaving the way our engine flags as constructive, and it is the starting point for your own risk and position-size decision.
Looking closely at the top performing listings reveals notable momentum across diverse price points. JAYKAY stands out with a +6.44% advance to ₹167.18, carrying a Very High strength rating within an established hourly uptrend. High-priced institutional heavyweights are also exhibiting powerful momentum, as seen in ABBOTINDIA, which gained +5.25% to trade at ₹27,270.00 with a High strength reading. Smaller capitalized growth counters also registered significant expansions, led by CAPILLARY, surging +7.82% to ₹484.05, and BHARTIHEXA, climbing +4.77% to ₹1,540.10.
Even counters undergoing light intraday pullbacks can maintain an Altrix Positive status if their underlying chart geography remains undamaged. For example, DCMSIL traded slightly lower at ₹70.26 (-0.04%), yet retained its High strength reading and Uptrend classification. This demonstrates that an hourly scan looks past temporary intraday dips to evaluate whether the broader structural breakout remains fully intact. Other notable movers maintaining positive technical signals include ZENITHEXPO at ₹203.95 (+3.55%), PAVNAIND at ₹15.67 (+4.82%), SVPGLOB at ₹3.49 (+4.18%), GANDHAR at ₹276.20 (+2.56%), SAMPANN at ₹24.67 (+1.69%), MITTAL at ₹0.77 (+1.32%), and ENIL at ₹101.90 (+1.04%).
What an Altrix Positive reading actually means for your portfolio
When individual investors examine quantitative output, a common misinterpretation is viewing an algorithmic positive signal as a direct recommendation to execute an immediate market order. In professional market operations, an Altrix Positive signal performs a diagnostic screening function rather than serving as automated advice.
For portfolio managers and individual investors, a positive reading highlights structural alignment. It confirms that supply is absorbing demand at progressively higher price levels on the 1-hour chart. Rather than buying blindly at the exact moment a flag is triggered, market participants should integrate these readings into a multi-step risk framing process:
- Contextual Validation: Verify whether the individual stock, such as BHARTIHEXA at ₹1,540.10 or ABBOTINDIA at ₹27,270.00, is extending away from a multi-session consolidation or simply extending further into overbought territory.
- Risk-to-Reward Calibration: Identify immediate technical support levels on the hourly chart. A positive reading indicates that structural parameters are favorable, but your position size must be defined by the distance between the current market price and your defined stop level.
- Confirmation Across Timeframes: Assess whether the hourly positive flag aligns with higher-timeframe trend structures on daily and weekly charts.
Using positive flags as a primary filter allows traders to allocate focus toward candidate stocks displaying proven momentum, avoiding capital lockup in stagnant or deteriorating chart patterns.
Stocks reading Altrix Negative
| Stock | Price (₹) | Change | Trend | Reading | Strength |
|---|---|---|---|---|---|
| BHEL | 439.90 | +2.49% | Uptrend | Altrix Negative | Low |
| BALAJEE | 25.31 | +1.12% | Uptrend | Altrix Negative | Low |
| MAHLIFE | 366.40 | +0.74% | Uptrend | Altrix Negative | Low |
| VIJAYA | 1,558.90 | +3.51% | Uptrend | Altrix Negative | Low |
| VRAJ | 127.74 | +3.02% | Uptrend | Altrix Negative | Low |
| ALMONDZ | 18.52 | +0.60% | Uptrend | Altrix Negative | Low |
| APLAPOLLO | 2,270.10 | +5.66% | Uptrend | Altrix Negative | Low |
| MHRIL | 199.29 | +1.84% | Uptrend | Altrix Negative | Low |
| PIRAMALFIN | 2,300.20 | +2.06% | Uptrend | Altrix Negative | Low |
| RUSHIL | 17.26 | +10.85% | Uptrend | Altrix Negative | Low |
Negative readings matter as much as positive ones. Traders use them to avoid adding to a losing position, and investors use them as a prompt to re-check why they own the stock at all.
Analyzing the negative snapshot reveals an essential nuance of quantitative scanning: every stock listed in this public subset displays an Uptrend directional classification paired with a Low strength Altrix Negative reading. This apparent divergence frequently occurs when a stock experiences a rapid price surge that exhibits distribution characteristics or short-term structural divergence on the 1-hour chart.
Consider RUSHIL, which posted a massive intraday gain of +10.85% to trade at ₹17.26, yet triggered an Altrix Negative reading with Low structural strength. Similarly, APLAPOLLO rose +5.66% to ₹2,270.10 and VIJAYA advanced +3.51% to ₹1,558.90, but both registered negative flags. Additional counters demonstrating positive price movement alongside negative technical indicators include VRAJ at ₹127.74 (+3.02%), BHEL at ₹439.90 (+2.49%), PIRAMALFIN at ₹2,300.20 (+2.06%), MHRIL at ₹199.29 (+1.84%), BALAJEE at ₹25.31 (+1.12%), MAHLIFE at ₹366.40 (+0.74%), and ALMONDZ at ₹18.52 (+0.60%). These flags alert investors that recent price spikes may lack underlying structural quality or sustainment volume.
Risks investors are underrating when analyzing negative flags
A common pitfall for market participants is dismissing an Altrix Negative signal when a stock's single-day percentage change is strongly positive. As observed in counters like RUSHIL (+10.85%) or APLAPOLLO (+5.66%), sharp green candles can create a false sense of security while quantitative engines detect early signals of institutional distribution or momentum loss.
Underrated risks in these specific chart configurations include
- Chasing Overextended Breakouts: Buying into a sharp intraday rally while the technical engine registers an Altrix Negative flag exposes traders to sharp mean-reversion pullbacks.
- Ignoring Divergence: When price makes a new intraday high while underlying hourly strength drops to Low, internal buying pressure is waning.
- Confusing Rebound Volatility with Sustained Accumulation: Rapid price jumps in volatile counters can be driven by short-covering rather than long-term institutional buying.
By respecting negative flags even during positive price sessions, risk-conscious investors protect capital from unexpected intraday reversals.
Where the strength is sitting by sector
| Sector | Stocks scanned | Positive readings | Negative readings |
|---|---|---|---|
| Manufacturing | 5 | 3 | 0 |
| FMCG | 8 | 4 | 2 |
| Technology | 9 | 4 | 1 |
| Energy | 10 | 4 | 1 |
| Banking | 11 | 4 | 4 |
| Materials | 6 | 2 | 0 |
| Metals | 6 | 2 | 1 |
| Other | 2258 | 690 | 759 |
| Auto | 9 | 2 | 3 |
| Consumer | 5 | 1 | 3 |
Sector concentration is usually the more durable signal: when positive readings cluster in one or two sectors, money is rotating rather than simply drifting, and that rotation tends to persist for several sessions.
Analyzing the sector-by-sector breakdown provides essential perspective on structural allocation across institutional sectors. Among targeted industry groups, Manufacturing demonstrates the highest density of positive structural signals, with 3 out of 5 scanned stocks generating Positive readings and 0 registering Negative flags. Materials also showcases structural clean sheets, with 2 out of 6 scanned stocks reading Positive against 0 Negative signals.
Larger industrial segments exhibit dynamic rotational balance. In FMCG, out of 8 scanned stocks, 4 show Positive readings against 2 Negative. In Technology, 4 out of 9 scanned counters read Positive while 1 reads Negative. Energy displays an identical profile with 4 Positive and 1 Negative reading out of 10 scanned listings.
Conversely, broader market participation shows neutral to cautious positioning in financial and cyclical segments. Banking counters show an even split across 11 scanned listings, with 4 Positive and 4 Negative readings. Metals logged 2 Positive and 1 Negative reading out of 6 scanned stocks. In Auto, 3 out of 9 scanned stocks read Negative against 2 Positive. Consumer displays defensive tilt, with 3 Negative readings out of 5 scanned stocks and only 1 Positive signal. The remaining broad cash universe, categorized under Other, encompasses 2258 scanned listings, generating 690 Positive readings and 759 Negative readings.
Sector mechanics and rotation signals
Tracking sector concentration allows market participants to identify where capital is congregating before individual stock breakouts materialize fully. When quantitative flags aggregate within a specific sector while negative signals remain suppressed, institutional capital is actively accumulating that asset group.
In today's snapshot, the structural contrast between Manufacturing (3 positive, 0 negative out of 5 scanned) and Consumer (1 positive, 3 negative out of 5 scanned) illustrates clear capital reallocation. Capital is favoring capital expenditure and industrial proxies while trimming exposure in defensive consumer counters. Similarly, Banking exhibits a divided tape (4 positive and 4 negative out of 11 scanned), signaling stock-specific dispersion rather than sector-wide momentum. Identifying these sector-level dynamics helps traders avoid battling broader sector headwinds.
How to use this snapshot
Start with breadth: 57% of scanned stocks in an uptrend sets the backdrop. Then look for clusters — one flagged stock is noise, six flagged stocks in the same sector is a theme. Finally, check the individual stock against its own levels before acting; a reading tells you the behaviour, not your entry, stop or size.
To execute a structured framework using this scan output
- Assess Market Regime: Evaluate overall market participation. With 1336 out of 2,356 stocks in an uptrend, overall directional risk favors long positions over short setups.
- Filter by Sector Momentum: Target sectors exhibiting heavy positive tilt, such as Manufacturing or Technology, while exercising extreme caution in sectors showing negative tilt, such as Consumer or Auto.
- Cross-Reference Single-Stock Data: When evaluating individual names like JAYKAY (+6.44%), CAPILLARY (+7.82%), or ABBOTINDIA (+5.25%), verify that current entry prices offer favorable risk-to-reward ratios relative to key hourly support zones.
What to watch next across the cash market
As trading progresses beyond the 11:29 am IST timestamp, market participants should monitor several key breadth variables to gauge whether buying pressure is expanding or dissipating:
- Uptrend Percentage Thresholds: Track whether broad market uptrend participation remains above the 57% baseline (1336 stocks). A drop below key market breadth thresholds indicates expanding momentum decay across broader cash listings.
- Expansion of Positive Signals: Watch if the total count of Altrix Positive readings expands beyond 168, or if Altrix Negative signals (306) continue to rise across the broader universe.
- Transitional Category Shifts: Keep close watch on the 245 Strengthening and 306 Improving counters. Continued accumulation in these categories can generate the next wave of Altrix Positive breakouts. Conversely, monitoring whether the 481 Weakening counters transition into negative flags provides an early indicator of broader market fatigue.
See the full Altrix board
This article shows a public snapshot only. Inside Altrix you get the complete list of flagged stocks across the whole NSE cash market on the 1-hour timeframe, refreshed every few minutes while the market is open, with each stock's trend, strength, latest flag date and how similar readings behaved historically — plus the screener, watchlist alerts, per-stock analysis charts and the Altrix assistant.
Frequently asked questions
How many stocks does Altrix scan?
The engine covers the full NSE cash-market universe on the 1-hour timeframe. In this run, 2,356 stocks had enough hourly history to produce a reading.
How often are the readings refreshed?
The scan runs on a rolling schedule through the trading day, so readings refresh every few minutes while the market is open.
Does an Altrix Positive reading mean I should buy?
No. It is a data observation on the hourly chart, not investment advice. Position sizing, stops and suitability remain your decision.
Is this the complete list?
No — this article is a public snapshot. The full board across every scanned stock, with per-stock charts and history, is inside Altrix.
What does it mean when a stock has an Altrix Negative reading while its trend is marked as Uptrend?
This situation occurs in counters like APLAPOLLO (+5.66%) or RUSHIL (+10.85%), where a stock's higher-level hourly trend structure remains intact, but short-term quantitative indicators detect momentum divergence, elevated distribution volume, or temporary overextension. It alerts traders that structural risk is elevated despite positive daily price gains.
What percentage of scanned stocks are currently maintaining an uptrend?
In this scan run, 1336 out of 2,356 evaluated cash-market listings maintained an intact uptrend, representing 57% of the scanned universe.
Key takeaways
- Stocks scanned: 2,356
- Altrix Positive: 168 — higher at the time of writing
- Altrix Negative: 306 — lower at the time of writing
- Stocks in uptrend: 1336 (57%)
About this report
Every figure on this page is read from a primary source at the timestamp shown — exchange boards for equities and indices, the exchange bid book for IPOs, published association rates for bullion, and consolidated exchange quotes for crypto — with no estimation or third-party commentary. Historical fields such as trailing returns and 52-week extremes are computed on the adjusted daily series so splits and bonuses do not create false gaps. A timestamp outside market hours reflects the last traded or last published value, not a live tick.
Related live pages
Sources
- TrendRipperX Altrix engine (1-hour readings across the NSE cash universe)
- NSE India price and volume data via our exchange data feed
- Altrix live board
“This report is generated automatically from live exchange and official association data at the time stamped above. Prices move continuously — verify on the source before acting. Nothing here is investment advice.”
Frequently asked questions
What is the story behind altrix Scan Flags 168 NSE Stocks Positive as Hourly Uptrends Reach 57%?
At 11:29 am IST on 20 September 2026, the Altrix scan evaluated 2,356 NSE stocks, flagging 168 positive and 306 negative setups across the cash market.
What the Altrix scan is showing on 20 September 2026?
Altrix ran across 2,356 NSE cash-market stocks on the 1-hour timeframe at 11:29 am IST. Of those, 168 currently read Altrix Positive, 306 read Altrix Negative, 245 are Strengthening, 306 are Improving and 481 are Weakening.
How to read these numbers and structural indicators?
Navigating technical scan data requires a clear understanding of what quantitative breadth signals represent on short-term chart structures. The 1-hour timeframe serves as an intermediate bridge between noisy intraday scalp cycles and slower daily swing charts.
What is happening with stocks reading Altrix Positive?
These are the strongest readings in the public snapshot. A positive reading is a structural observation on the hourly chart, not a buy call — it tells you the stock is behaving the way our engine flags as constructive, and it is the starting point for your own risk and position-size decision.
What an Altrix Positive reading actually means for your portfolio?
When individual investors examine quantitative output, a common misinterpretation is viewing an algorithmic positive signal as a direct recommendation to execute an immediate market order.
What should you know about stocks reading Altrix Negative?
Negative readings matter as much as positive ones. Traders use them to avoid adding to a losing position, and investors use them as a prompt to re-check why they own the stock at all.
Comments
Comments are moderated. Be civil, no stock tips or promotions.
Loading comments…
Related articles

Altrix Sector Strength: Manufacturing leads NSE scan with 60% positive share
Altrix scanned 2,356 NSE stocks on the 1-hour timeframe for the week of 20 September 2026, revealing Manufacturing at a top 60% positive share while Pharmaceuticals faces 63% negative pressure.

Motilal Oswal Bullish on Jewellery Stocks: Titan, Kalyan Jewellers Remain Top Picks
Motilal Oswal remains positive on India's organised jewellery sector, highlighting Titan and Kalyan Jewellers as preferred names. Formalisation, premiumisation, store expansion and strong brand positioning remain key growth drivers.
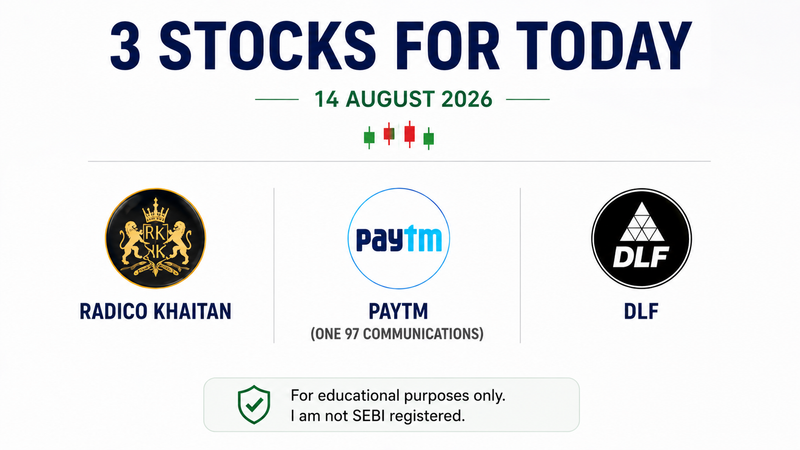
3 Stocks in Focus on 14 August: Radico Khaitan, Paytm and DLF Show Positive Technical Setup
Radico Khaitan, Paytm and DLF are in focus on August 14 after Motilal Oswal's Chandan Taparia highlighted positive technical setups across the three stocks. Here's what the charts and market indicators suggest.
Newsletter