

ABB India Limited Q2 FY27 Results: Net Profit ₹443 cr
Quick answer
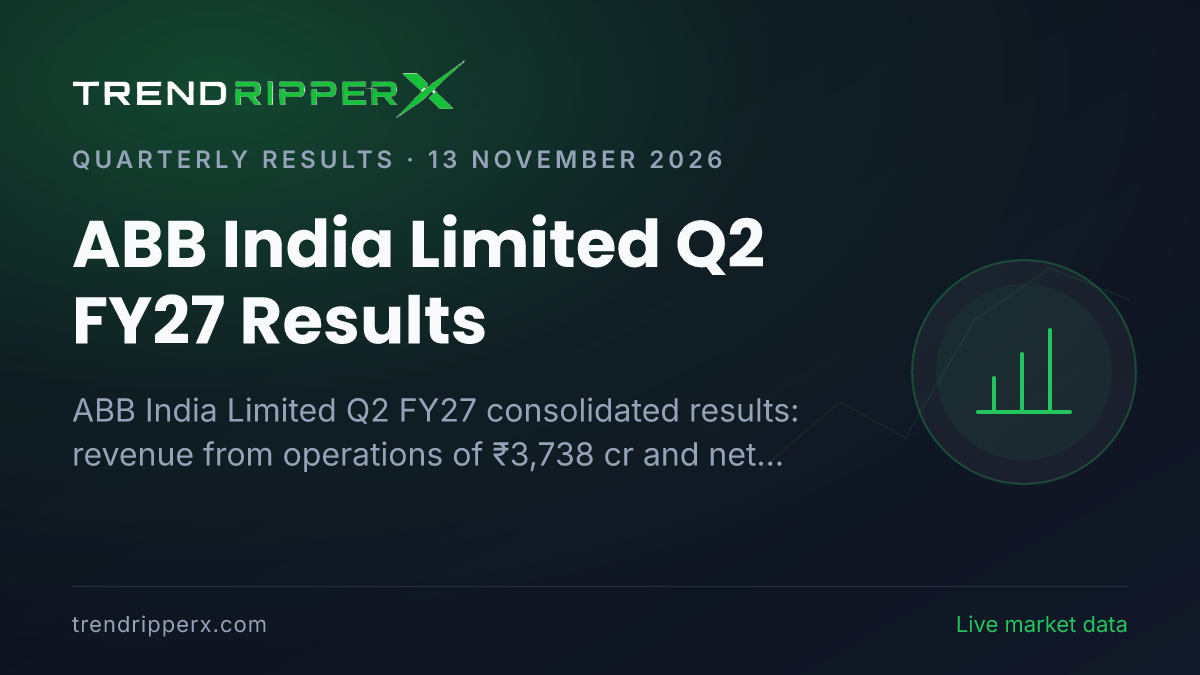
ABB India Limited Q2 FY27 consolidated results: revenue from operations of ₹3,738 cr and net profit of ₹443 cr.
Figures are from the company's reported results for the stated period; year-on-year comparisons use the same quarter of the previous year.
Quick summary
Revenue
₹3,738 cr
Net Profit
₹443 cr
ABB India Limited has filed its Consolidated financial results for the quarter ended 2026-09-30 with NSE. Revenue from operations was ₹3,738 cr, while net profit stood at ₹443 cr. These are reported statement figures, not estimates or a board-meeting announcement.
Official Q2 FY27 scorecard
All amounts are in ₹ crore, except per-share earnings in rupees. Comparisons use verified same-basis official quarterly filings; a dash means an individual figure or percentage could not be verified. Unavailable periods are omitted, not estimated.
Swipe sideways to see all columns →
| Metric | Q2 FY27 | Previous quarter (2026-06-30) | Year-ago quarter (2025-09-30) | QoQ | YoY |
|---|---|---|---|---|---|
| Revenue from operations | ₹3,738 cr | ₹3,559 cr | ₹3,311 cr | +5.0% | +12.9% |
| Other income | ₹78.35 cr | ₹92.67 cr | ₹83.95 cr | -15.5% | -6.7% |
| Total income | ₹3,816 cr | ₹3,652 cr | ₹3,395 cr | +4.5% | +12.4% |
| Cost of materials | ₹2,089 cr | ₹1,757 cr | ₹1,756 cr | +18.8% | +18.9% |
| Employee costs | ₹225 cr | ₹251 cr | ₹222 cr | -10.4% | +1.2% |
| Depreciation | ₹44.27 cr | ₹39.23 cr | ₹36.59 cr | +12.8% | +21.0% |
| Total expenses | ₹3,236 cr | ₹3,153 cr | ₹2,853 cr | +2.6% | +13.4% |
| Operating profit (EBITDA, derived) | ₹552 cr | ₹447 cr | ₹500 cr | +23.5% | +10.3% |
| Exceptional items | ₹0 cr | ₹0 cr | ₹0 cr | — | — |
| Profit before tax | ₹581 cr | ₹499 cr | ₹542 cr | +16.4% | +7.1% |
| Tax expense | ₹141 cr | ₹129 cr | ₹133 cr | +9.4% | +5.7% |
| Finance costs | ₹5.42 cr | ₹1.71 cr | ₹5.64 cr | +217.0% | -3.9% |
| Net profit / loss | ₹443 cr | ₹362 cr | ₹409 cr | +22.1% | +8.2% |
| Basic EPS | ₹20.76 | ₹17.46 | ₹19.30 | +18.9% | +7.6% |
Year-on-year performance: what changed
- Revenue from operations: ₹3,738 cr, compared with ₹3,311 cr in the same quarter last year; increased by ₹427 cr (+12.9%).
- Net profit / loss: ₹443 cr, compared with ₹409 cr in the same quarter last year; increased by ₹33.48 cr (+8.2%).
- Profit before tax: ₹581 cr, compared with ₹542 cr in the same quarter last year; increased by ₹38.53 cr (+7.1%).
- Operating profit (derived EBITDA): ₹552 cr, compared with ₹500 cr in the same quarter last year; increased by ₹51.59 cr (+10.3%).
- Basic EPS: ₹20.76, compared with ₹19.30 in the same quarter last year; increased by ₹1.46 (+7.6%).
Quarter-on-quarter performance
- Revenue from operations: ₹3,738 cr, compared with ₹3,559 cr in the immediately preceding quarter; increased by ₹179 cr (+5.0%).
- Net profit / loss: ₹443 cr, compared with ₹362 cr in the immediately preceding quarter; increased by ₹80.22 cr (+22.1%).
- Profit before tax: ₹581 cr, compared with ₹499 cr in the immediately preceding quarter; increased by ₹81.87 cr (+16.4%).
- Operating profit (derived EBITDA): ₹552 cr, compared with ₹447 cr in the immediately preceding quarter; increased by ₹105 cr (+23.5%).
- Basic EPS: ₹20.76, compared with ₹17.46 in the immediately preceding quarter; increased by ₹3.30 (+18.9%).
Year-on-year comparisons match the same season; sequential comparisons measure the change from the preceding three-month period and may reflect seasonality. Neither comparison alone establishes the business cause of the movement. Scorecard percentage changes use the absolute prior-period value; a loss turnaround is not ordinary profit growth.
Margins and financial ratios
- Net profit margin: 11.84%. Previous quarter: 10.18%, up 166 basis points. Year-ago quarter: 12.36%, down 52 basis points.
- Derived EBITDA margin: 14.77%. Previous quarter: 12.56%, up 220 basis points. Year-ago quarter: 15.11%, down 35 basis points.
- Total expenses / revenue: 86.56%. Previous quarter: 88.59%, down 2.03 percentage points. Year-ago quarter: 86.16%, up 0.40 percentage points.
- Other income / total income: 2.05%. Previous quarter: 2.54%, down 0.48 percentage points. Year-ago quarter: 2.47%, down 0.42 percentage points.
- Effective tax rate (tax expense / positive PBT): 24.25%. Previous quarter: 25.80%, down 1.55 percentage points. Year-ago quarter: 24.58%, down 0.32 percentage points.
Margin movements are measured in basis points, not percentage growth: 100 basis points equals one percentage point. Cost ratios measure the share of reported revenue absorbed by a cost, not a forecast.
Cost structure and operating earnings
- Cost of materials: ₹2,089 cr (previous quarter ₹1,757 cr, +18.8% QoQ) (year-ago ₹1,756 cr, +18.9% YoY) — 55.87% of revenue
- Employee costs: ₹225 cr (previous quarter ₹251 cr, -10.4% QoQ) (year-ago ₹222 cr, +1.2% YoY) — 6.01% of revenue
- Finance costs: ₹5.42 cr (previous quarter ₹1.71 cr, +217.0% QoQ) (year-ago ₹5.64 cr, -3.9% YoY) — 0.14% of revenue
- Depreciation: ₹44.27 cr (previous quarter ₹39.23 cr, +12.8% QoQ) (year-ago ₹36.59 cr, +21.0% YoY) — 1.18% of revenue
The derived EBITDA proxy, adjusted to exclude other income and exceptional items, was ₹552 cr, equivalent to +14.8% of revenue against +15.1% a year earlier. Reconciliation: profit before tax ₹581 cr + finance costs ₹5.42 cr + depreciation ₹44.27 cr − other income ₹78.35 cr − signed exceptional items ₹0 cr. This is an analytical calculation, not company-reported EBITDA; statement classification and exceptional-item signs should be checked against the official notes. A rising expense ratio means the reported costs absorb more of the revenue denominator; it does not by itself identify demand, pricing or efficiency changes.
Tax, other income and earnings quality
Profit before tax was ₹581 cr. Reported tax expense was ₹141 cr, equivalent to 24.25% of positive profit before tax. Other income was ₹78.35 cr, or 2.05% of total income; its recurring or non-recurring nature must be checked in the notes. The statement reports exceptional items of ₹0 cr; the number alone does not identify their nature or recurrence. Net profit is not the same as cash generated from operations, and no cash-conversion conclusion is drawn without a verified cash-flow statement.
Earnings per share
Basic EPS was ₹20.76. Diluted EPS was not verified. EPS is expressed in rupees per share, not crore. Profit and EPS can move differently when share counts change; this report does not infer a share issuance, buyback or dilution event without verified disclosures.
Reporting basis and disclosure checks
This report uses Consolidated figures only; standalone and consolidated statements are not combined. The reporting period ends on 2026-09-30; the exchange records the filing time as 13-Nov-2026 18:00:28. The quarter-end date is not the announcement date. Segment performance, cash flow, debt, exceptional items, dividend decisions, auditor qualifications and management guidance are not asserted where the structured filing has not verified them. Read the attached official statement and notes before drawing conclusions.
What to track after the result
Compare future revenue, earnings and margins on the same reporting basis and accounting period. Check the official notes for restatements and non-recurring items; a quarterly profit number is not a share-price forecast. No live share-price reaction, analyst consensus, dividend or guidance is inferred from these statement figures.
Sources
Disclosure: Financial information and analysis only; not investment advice. Official filings can be amended; missing or unsupported fields are not estimated.
Frequently asked questions
What has changed for ABB?
ABB India Limited Q2 FY27 consolidated results: revenue from operations of ₹3,738 cr and net profit of ₹443 cr.
What do the numbers in official Q2 FY27 scorecard show?
All amounts are in ₹ crore, except per-share earnings in rupees. Comparisons use verified same-basis official quarterly filings; a dash means an individual figure or percentage could not be verified. Unavailable periods are omitted, not estimated.
How significant is year-on-year performance: what changed?
Revenue from operations: ₹3,738 cr, compared with ₹3,311 cr in the same quarter last year; increased by ₹427 cr (+12.9%).
What should you know about quarter-on-quarter performance?
Revenue from operations: ₹3,738 cr, compared with ₹3,559 cr in the immediately preceding quarter; increased by ₹179 cr (+5.0%).
What stood out in margins and financial ratios?
Net profit margin: 11.84%. Previous quarter: 10.18%, up 166 basis points. Year-ago quarter: 12.36%, down 52 basis points.
How did cost structure and operating earnings perform this quarter?
Cost of materials: ₹2,089 cr (previous quarter ₹1,757 cr, +18.8% QoQ) (year-ago ₹1,756 cr, +18.9% YoY) — 55.87% of revenue.
Comments
Comments are moderated. Be civil, no stock tips or promotions.
Loading comments…
Written by TrendRipperX Data Desk. Figures come from exchange, company and market-data sources linked in the story. Spotted an error? Tell the newsroom — see our corrections policy and editorial policy.
For information only, not investment advice. TrendRipperX is not a SEBI-registered adviser. Full disclaimer.
Related articles

Tata Motors Passenger Vehicles Limited Q2 FY27 Results: Net Profit ₹3 cr
Tata Motors Passenger Vehicles Limited Q2 FY27 standalone results: revenue from operations of ₹19,201 cr and net profit of ₹3 cr.
Grasim Industries Limited Q2 FY27 Results: Net Profit ₹1,029 cr
Grasim Industries Limited Q2 FY27 consolidated results: revenue from operations of ₹50,105 cr and net profit of ₹1,029 cr.

Dish Tv India Share Price Trades Flat at ₹2.05 as Q2 Loss Touches ₹295 Cr
Dish Tv India trades at ₹2.05 following Q2 results reporting a net loss of ₹295 cr against revenue of ₹292 cr. Here is the market breakdown and level analysis.
Newsletter