

Altrix Sector Strength: Manufacturing leads NSE scan with 60% positive share
Quick answer
Altrix scanned 2,356 NSE stocks on the 1-hour timeframe for the week of 20 September 2026, revealing Manufacturing at a top 60% positive share while Pharmaceuticals faces 63% negative pressure.

Quick summary
Leading sector
Manufacturing
Stocks scanned
2,356
Sectors covered
12
BODY:
Capital allocators tracking intraday breadth signals across the Indian equity landscape saw clear sector rotation emerging during the week of 20 September 2026. Scanning across 2,356 NSE stocks on the 1-hour timeframe, the Altrix sector strength board demonstrates how liquidity is concentrating in focused industrial pockets rather than lifting the broad market simultaneously. When market participants dissect structural market movements, sector-level participation provides the foundational context needed to separate sustainable momentum from isolated price spikes.
Understanding hourly breadth is essential for active capital deployment. Rather than relying on headline index ticks that can be skewed by a handful of mega-cap counters, analyzing multi-stock sector aggregates reveals where institutional order flow is accumulating. In this week's comprehensive scan covering 2,356 instruments across 12 sectors, the underlying signals showcase a distinct divergence between expanding industrial leadership and deteriorating healthcare sentiment.
Which sectors the Altrix scan is favouring
Across 2,356 NSE stocks scanned on the 1-hour timeframe, Manufacturing currently holds the highest share of positive readings — 3 of 5 stocks scanned in the sector. Sector-level readings are the part of the board that changes slowest, which is why they are the most useful for deciding where to hunt for ideas next week.
When evaluating sectoral health, the total volume of positive indicators relative to total constituent stocks isolates true structural accumulation. In Manufacturing, where 3 out of 5 scanned counters reflect bullish setup structures, the resulting 60% positive share places it at the apex of the national exchange landscape. This industrial resilience highlights how selective buying can create clear outperformance even when broader institutional participation remains mixed across secondary cash segments.
Following close behind, the Fast-Moving Consumer Goods (FMCG) segment captured a 50% positive share, with 4 out of 8 scanned counters exhibiting constructive trend characteristics, while 2 counters showed negative readings. Meanwhile, Technology logged 4 positive readings out of 9 scanned counters (44% positive share, 1 negative reading), and Energy posted 4 positive signals out of 10 scanned stocks (40% positive share, 1 negative reading). Banking rounded out the primary covered groups with 4 positive and 4 negative readings out of 11 scanned stocks, translating to a 36% positive share.
Strongest sectors right now
| Sector | Stocks scanned | Positive | Negative | Positive share |
|---|---|---|---|---|
| Manufacturing | 5 | 3 | 0 | 60% |
| FMCG | 8 | 4 | 2 | 50% |
| Technology | 9 | 4 | 1 | 44% |
| Energy | 10 | 4 | 1 | 40% |
| Banking | 11 | 4 | 4 | 36% |
Analyzing the top half of the board demonstrates how positive momentum diffuses across defensive and cyclical pockets. The presence of Manufacturing at a 60% positive share (3 positive, 0 negative out of 5 scanned) indicates complete structural stability across its scanned cohort, as zero constituents registered negative trends on the 1-hour chart. This contrasts with FMCG, where despite a healthy 50% positive share across 8 scanned stocks (4 positive, 2 negative), underlying dispersion remains visible.
For technology counters, 4 positive readings out of 9 scanned stocks represent a 44% positive share, accompanied by 1 negative reading. Energy reflects a comparable distribution with 4 positive setups out of 10 scanned equities (40% positive share, 1 negative). In Banking, the aggregate balance shows 4 positive and 4 negative readings out of 11 scanned counters (36% positive share), capturing an ongoing tug-of-war between accumulation and profit booking across financial majors.
Sectors under the most pressure
| Sector | Stocks scanned | Positive | Negative | Negative share |
|---|---|---|---|---|
| Pharmaceuticals | 8 | 1 | 5 | 63% |
| Financials | 7 | 1 | 2 | 29% |
| Consumer | 5 | 1 | 3 | 60% |
| Auto | 9 | 2 | 3 | 33% |
| Other | 2258 | 690 | 759 | 34% |
On the opposite side of the ledger, specific defensive and consumer segments face pronounced selling pressure. Pharmaceuticals leads the list of lagging sectors, carrying a 63% negative share on the back of 5 negative readings and only 1 positive setup out of 8 scanned stocks. When healthcare constituents demonstrate such heavy downside concentration on the 1-hour timeframe, tactical rallies in the sector encounter persistent overhead supply.
Similarly, the broader Consumer category reflects notable weakness, recording a 60% negative share with 3 negative stocks and 1 positive reading out of 5 scanned counters. Financials registered 1 positive and 2 negative readings across 7 scanned stocks (29% negative share), while Auto recorded 2 positive and 3 negative readings out of 9 scanned equities (33% negative share). Across the expansive Other broad-market basket of 2258 equities, 690 stocks held positive readings against 759 negative setups, establishing a 34% negative share across the general cash universe.
How to interpret hourly market breadth for risk control
Hourly market breadth serves as a early-warning mechanism for active traders and risk managers. Because individual stock charts on a 1-hour interval resolve faster than daily or weekly trends, tracking aggregate sector health allows investors to gauge whether buying pressure is expanding or contracting across related names before major index-level moves materialize.
When market breadth in a sector like Pharmaceuticals decays to a 63% negative share with 5 out of 8 stocks displaying negative flags, attempting to buy isolated pullbacks carries elevated downside risk. Conversely, when Manufacturing maintains a 60% positive share with 3 out of 5 stocks flagged positive and 0 negative readings, dips within that sector benefit from underlying structural support, offering more reliable entry points for tactical momentum strategies.
Portfolio positioning: What these readings mean for traders and investors
For active portfolio managers, the divergence between leading sectors (Manufacturing at 60% positive share) and lagging sectors (Pharmaceuticals at 63% negative share) provides clear operational guidelines. Allocating capital toward high-breadth sectors aligns trading positions with prevailing institutional liquidity, maximizing the probability of trend continuation.
- For short-term momentum traders: Focus scan queries on the top-performing groups — specifically Manufacturing (60% positive share), FMCG (50% positive share), and Technology (44% positive share). Individual breakouts in these sectors require less overall market push to achieve upside targets because sector-level tailwinds reinforce constituent strength.
- For swing investors and risk officers: Exercise strict position sizing and implement tighter stop-loss thresholds when managing exposure in Pharmaceuticals (63% negative share), Consumer (60% negative share), and Auto (33% negative share). In weak breadth environments, dead-cat bounces frequently fail near hourly resistance levels.
- For broad-market allocators: Track the massive 2258 stock Other category, where 690 positive and 759 negative readings (34% negative share) signal a stock-picker's environment requiring disciplined individual constituent verification rather than passive index-heavy bets.
Reading the rotation
When one sector holds a clearly higher share of positive readings than the rest, capital is rotating into it rather than the whole market lifting together. In practice that means two things: ideas from the leading sectors need less of a market tailwind to work, and positions in the lagging sectors need tighter risk because every rally there is fighting the flow.
Rotational dynamics explain why broad index averages can remain relatively unchanged while underlying equities experience significant performance splits. For example, while Banking reflects balanced sentiment with 4 positive and 4 negative stocks out of 11 scanned (36% positive share), institutional capital active in the cash market is actively shifting out of healthcare names (1 positive vs 5 negative out of 8 in Pharmaceuticals) and reallocating directly into manufacturing plays (3 positive out of 5 in Manufacturing).
Risks investors are underrating in lagging sectors
A frequent pitfall for retail investors is mistaking sharp downside contractions in lagging sectors for attractive value opportunities. In sectors showing severe breadth deterioration, such as Pharmaceuticals (63% negative share) or Consumer (60% negative share), persistent institutional distribution creates continuous supply overhead that absorbs buying enthusiasm.
Without waiting for hourly breadth indicators to stabilize and turn positive, early entries into lagging groups expose portfolios to prolonged underperformance. Until sectors with high negative shares demonstrate structural consolidation and a reduction in negative stock counts, buying strength in leading sectors like Manufacturing (60% positive share) remains a mathematically superior risk-reward strategy.
What to watch through the week
Track whether Manufacturing keeps its lead or hands it over — a change at the top of this table is usually the earliest sign of a rotation, well before it shows up in index levels. The same table inside Altrix updates every few minutes and drills straight through to the individual stocks behind each count.
Market participants should specifically monitor if FMCG (4 positive out of 8) or Technology (4 positive out of 9) can expand their positive shares toward 60%, signaling a broadening of market leadership. Conversely, watch whether Pharmaceuticals can reduce its 5 negative flags out of 8 scanned stocks, or if distribution spreads further into adjacent segments like Financials (2 negative out of 7) and Auto (3 negative out of 9).
See the full Altrix board
This article shows a public snapshot only. Inside Altrix you get the complete list of flagged stocks across the whole NSE cash market on the 1-hour timeframe, refreshed every few minutes while the market is open, with each stock's trend, strength, latest flag date and how similar readings behaved historically — plus the screener, watchlist alerts, per-stock analysis charts and the Altrix assistant.
Frequently asked questions
What does a high positive share mean for a sector?
It means a large proportion of the stocks scanned in that sector currently carry a constructive Altrix reading on the hourly chart. It is a breadth measure, not a price target. For instance, Manufacturing leading with a 60% positive share (3 of 5 stocks) indicates robust internal participation across that specific industrial group.
How many sectors are covered?
This week's scan produced readings across 12 sectors with at least 5 scanned stocks each.
Can I see the stocks behind these counts?
Yes — the Altrix screener lists every scanned stock with its own reading, trend, strength and chart.
Why is the 1-hour timeframe useful for identifying sector rotation?
The 1-hour timeframe strikes a balance between capturing immediate intraday capital movement and filtering out random tick noise. It allows traders to spot institutional accumulation or distribution in sectors like Manufacturing (60% positive) or Pharmaceuticals (63% negative) hours or days before those shifts become visible on daily charts.
How should I handle sectors with high negative shares like Pharmaceuticals?
Sectors carrying high negative shares, such as Pharmaceuticals at 63% (5 negative of 8 scanned stocks) and Consumer at 60% (3 negative of 5 scanned stocks), require defensive management. Traders typically avoid aggressive long entries in these groups until hourly trend signals show structural improvement and negative constituent counts decline.
Key takeaways
- Leading sector: Manufacturing — higher at the time of writing (60% positive share, 3 of 5 stocks positive)
- Stocks scanned: 2,356
- Sectors covered: 12
About this report
Every figure on this page is read from a primary source at the timestamp shown — exchange boards for equities and indices, the exchange bid book for IPOs, published association rates for bullion, and consolidated exchange quotes for crypto — with no estimation or third-party commentary. Historical fields such as trailing returns and 52-week extremes are computed on the adjusted daily series so splits and bonuses do not create false gaps. A timestamp outside market hours reflects the last traded or last published value, not a live tick.
Related live pages
Sources
- TrendRipperX Altrix engine (1-hour readings across the NSE cash universe)
- NSE India price and volume data via our exchange data feed
“This report is generated automatically from live exchange and official association data at the time stamped above. Prices move continuously — verify on the source before acting. Nothing here is investment advice.”
Frequently asked questions
Altrix Sector Strength: Manufacturing leads NSE scan with 60% positive share — what exactly happened?
Altrix scanned 2,356 NSE stocks on the 1-hour timeframe for the week of 20 September 2026, revealing Manufacturing at a top 60% positive share while Pharmaceuticals faces 63% negative pressure.
Which sectors the Altrix scan is favouring?
Across 2,356 NSE stocks scanned on the 1-hour timeframe, Manufacturing currently holds the highest share of positive readings — 3 of 5 stocks scanned in the sector. Sector-level readings are the part of the board that changes slowest, which is why they are the most useful for deciding where to hunt for ideas next week.
What is happening with strongest sectors right now?
Analyzing the top half of the board demonstrates how positive momentum diffuses across defensive and cyclical pockets.
What does sectors under the most pressure mean for investors?
On the opposite side of the ledger, specific defensive and consumer segments face pronounced selling pressure. Pharmaceuticals leads the list of lagging sectors, carrying a 63% negative share on the back of 5 negative readings and only 1 positive setup out of 8 scanned stocks.
How to interpret hourly market breadth for risk control?
Hourly market breadth serves as a early-warning mechanism for active traders and risk managers.
What are the key points on portfolio positioning: What these readings mean for traders and investors?
For active portfolio managers, the divergence between leading sectors (Manufacturing at 60% positive share) and lagging sectors (Pharmaceuticals at 63% negative share) provides clear operational guidelines.
Comments
Comments are moderated. Be civil, no stock tips or promotions.
Loading comments…
Related articles

Altrix Scan Flags 168 NSE Stocks Positive as Hourly Uptrends Reach 57%
At 11:29 am IST on 20 September 2026, the Altrix scan evaluated 2,356 NSE stocks, flagging 168 positive and 306 negative setups across the cash market.

Motilal Oswal Bullish on Jewellery Stocks: Titan, Kalyan Jewellers Remain Top Picks
Motilal Oswal remains positive on India's organised jewellery sector, highlighting Titan and Kalyan Jewellers as preferred names. Formalisation, premiumisation, store expansion and strong brand positioning remain key growth drivers.
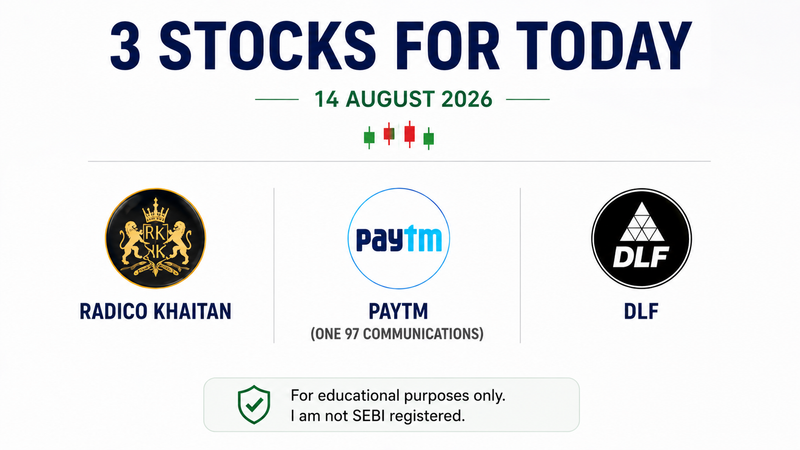
3 Stocks in Focus on 14 August: Radico Khaitan, Paytm and DLF Show Positive Technical Setup
Radico Khaitan, Paytm and DLF are in focus on August 14 after Motilal Oswal's Chandan Taparia highlighted positive technical setups across the three stocks. Here's what the charts and market indicators suggest.
Newsletter